本研究は、オープンデータによる行動変容を台湾のケースを事例に実証的に解析したものです。具体的には、台湾の55の地域にある1,658店舗のマスク販売枚数や地域レベルでのマスクマップの利用状況に関するデータを用いて市民の購買行動の分析を行いました。解析結果からは、マスクマップ利用率が高い地域では、一日あたりの店舗ごとのマスク販売実績数はそれ以外の地域の販売店に比べて平均で世帯あたり2.079枚程度少なく、マスクのパニック購買行動の軽減がみられたことが示唆されました。さらに、大学卒業者の割合が大きい地域で特に販売実績が減少することが明らかになり(平均で14.514枚程度)、社会経済状況に応じてデジタルソリューションがもたらす効果が異なることも示唆されました。
This study empirically analyzes the impacts of open data on behavioral change by investigating the case of Taiwan. In Taiwan, each retailer’s mask stock level was made publicly open, enabling citizens to check the availability of masks at nearby stores from their smartphones in near real-time. This study analyzes citizens’ mask purchase behaviors by using data on the number of masks sold at 1658 stores in 55 regions in Taiwan and the usage of the mask map at the area level. This study found that the average of daily sold mask numbers per store per household among stores located in mask map use areas was fewer than those of other stores by 2.079. These results indicate a reduced panic buying behavior as a consequence of the openly accessible information in the form of an online mask map. Furthermore, the results also suggested that such open-data-based countermeasures did not equally impact every citizen and rather varied among socioeconomic conditions, particularly the education level (average effect of mask map usage: -14.514).
【論文情報】
Shibuya, Y., Lai, CM., Hamm, A. et al. Do open data impact citizens’ behavior? Assessing face mask panic buying behaviors during the Covid-19 pandemic. Sci Rep 12, 17607 (2022). https://doi.org/10.1038/s41598-022-22471-y
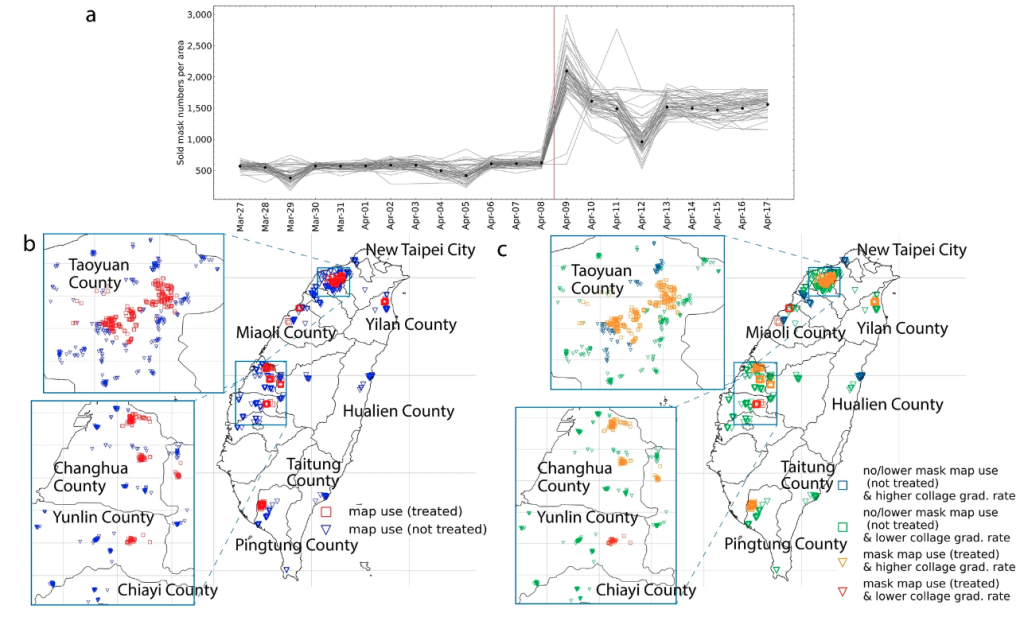
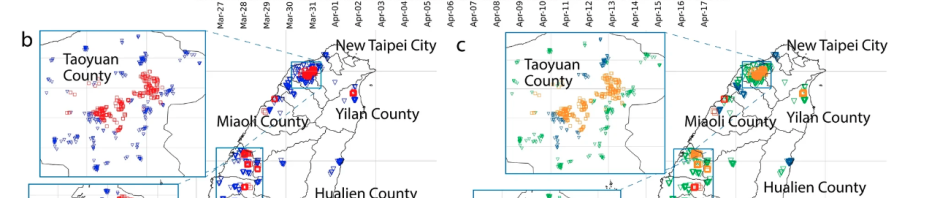
Figure 1. Average sold face mask numbers per area before and after the government loosened the mask purchase policy (Panel (a), the red line indicates when the policy was changed). The launch date of the mask map is outside of Panel (a) (the launch was in February 2020). The target mask selling stores’ locations are shown in Panels (b) and (c). In Panel (b), the stores are plotted in red if they locate in the mask map use areas (more than 1 % of mask map use), otherwise blue. In Panel (c), stores are further categorized according to
the areas’ college graduate rates. Several areas do not show any stores in the panels because there were no corresponding mask map usage data in those areas. Thus, they were excluded from the analysis (see “Methods” section). See Table S2 in Supplementary Materials for area information. The maps of Panels (b) and (c) were created by the authors with Python 3.10.2. and GADM (https://gadm.org).